What is Bode Plot?
It is one of the methods used to draw complex mathematical functions including the transfer functions (TFs) of different systems to study their stabilities.
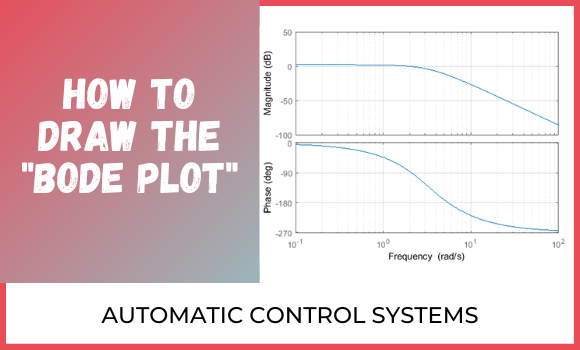
The bode plot consists of two graphs, one of which contains the Gain for different frequencies and the other contains the phase difference for the different frequencies. Moreover; the logarithmic coordinates are used in drawing the bode plot so that we can draw a wide range of the function. The Gain is always in "decibels" and the phase difference is always in "degrees".
The bode plot consists of two graphs, one of which contains the Gain for different frequencies and the other contains the phase difference for the different frequencies. Moreover; the logarithmic coordinates are used in drawing the bode plot so that we can draw a wide range of the function. The Gain is always in "decibels" and the phase difference is always in "degrees".
What is Bode Plot used for?
It is used for studying the stability of different systems.
How to draw Bode Plot? (7 Steps)
- Mathematically analyze both the numerator and denominator and put them in their simplest form.
- Replace each "S" in the numerator and denominator with "j𝟂" given that:
- Form the Gain's and phase difference's equations.
If parentheses exist in either the numerator or denominator, then the Gain for each parenthesis is
, and the phase difference for each parenthesis is
Note that the Gain's equation is preceded by "20 log", and that's to convert the Gain's unit from "unit" to "decibel" - Create a table to record the values of Gain and phase difference for the values of the selected frequencies within the range (10^-1 , 10^2), since this range of frequencies is more than sufficient in Automatic Control Systems' applications. It is also preferable to choose divergent values within the previous range so that the bode plot is extended over the entire paper.
- Program the calculator to insert the Gain's equation to calculate the different Gains' values in terms of the chosen frequencies and record the obtained values in the table, and then reprogram the calculator and insert the phase difference's equation to calculate the different values of phase difference in terms of the chosen frequencies values and record the obtained values in the table.
- Draw the bode plot on a logarithmic graph paper. As we said before, the bode plot consists of two graphs: The first graph represents the gain's values for the different frequencies values (the Gain's values are in decibel and are represented on the Y- axis while the different frequencies are in rad/s and are represented on the X-axis). The second graph represents the phase difference values for the different frequencies (the phase difference values are in degrees and are represented on the Y-axis while the different frequencies are in rad/s and are represented on the X-axis)
- Finally, study the stability of the system according to the following:
If the Gain's line crosses the 0dB line, and at the same time the phase difference line is lower than (-𝞹), the system is unstable. In other words; for the system to be stable, the phase difference line must be higher than (-𝞹) at the moment when the Gain's line crosses below the 0dB line
How to program the calculator?
Note: this explanation applies to (CASIO) Scientific Calculator (FX-991ESPLUS)
- Press the "MODE" button.
- Press number "7" to choose "TABLE".
- Insert the gain's equation and don't forget the "20 log". Then press "=".
Note that "𝟂" is expressed in the calculator as "X". To type "X" in the calculator, press the "ALPHA" button. Then press the ")" button. - When the word "START" appears on the screen of the calculator, insert the first value of the frequency. Then press "=".
- When the word "END" appears on the screen of the calculator, insert the last value of the frequency. Then press "=".
- When the word "STEP?" appears on the screen of the calculator, insert the increased amount between the successively chosen frequencies. Then press "=".
- The calculator will take some time to do the calculations. Once finished, a table similar to the following will appear on the screen of the calculator.Note If we have one value for the frequency we put the values of "START", "END", and "STEP?" the same as the value of the chosen frequency
Bode Plot in Matlab
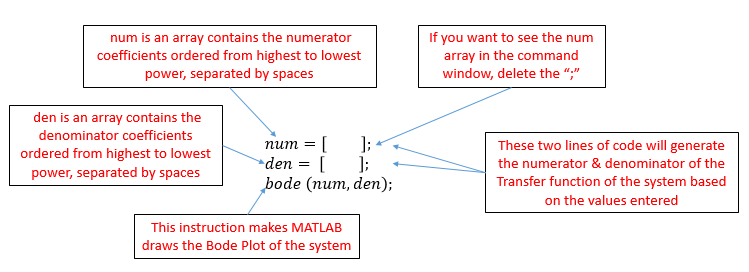
There are two methods to draw bode plot in Matlab:
- First method:
- Second method:
In this method, we must first make the numerator and denominator in the form of polynomial functions
Online Bode Plot Generator
*****This Summary is available as PDF File
Click here to get a PDF Copy*****


